Articles
Syngeneic model for preclinical evaluation of ovarian cancer
01 Sep 2018
Ovarian cancer is considered a relatively rare gynecologic malignancy but has one of the highest mortality rates due to the non-specific symptoms that occur in early stage disease. This results in most women being diagnosed with advanced stage disease. The incidence of ovarian cancer within the United States is approximately 22,000 cases per year and results in approximately 14,000 deaths per year.
Even though a number of advances have been made in cancer treatments and surgical approaches, little progress in ovarian cancer therapy has provided a meaningful impact on this patient population. While initial response rates can be high, more than 80% of patients will relapse after front-line therapy and over 50% of these women will die within 5 years of diagnosis.
Limited second-line options in 1st line refractory patients along with late stage diagnosis both contribute to the poor overall survival and make this a highly unmet medical need that has been an active area of oncology drug discovery. Recent success with immunotherapies in other cancers provides some hope for ovarian cancer patients. One of the most promising pieces of data reported that the presence of tumor infiltrating lymphocytes positively correlated with improved overall survival of ovarian cancer patients.[1]
ID8 Murine Ovarian Carcinoma Model for Use as a Preclinical Syngeneic Model
At Labcorp we have established the ID8 murine ovarian carcinoma model as a preclinical syngeneic model that can be used to track and monitor disease progression and therapeutic outcomes. Our model relies on the intraperitoneal delivery of luciferase-expressing ID8 cells to mimic aspects of human disease. Following implantation in vivo, the ID8-luc cells demonstrate a 7-8 day tumor doubling time and a median overall survival of approximately 40-50 days. Body weight loss over time has not been observed in this model. However, weight gain is common due to accumulation of peritoneal ascites associated with late-stage disease (Figures 1A, B, C).
Fig. 1: In Vivo Evaluation of ID8-luc Model in C67BL/6 Mice Over Time
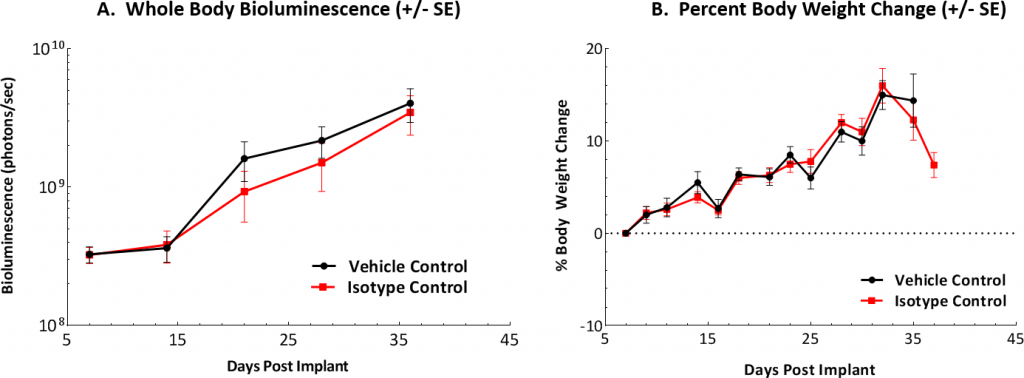
Fig. 1A: Graphical representation of tumor burden found in control mice following IP implantation.
Fig. 1B: Body weights were measured three times weekly and percent change from day of implant (day 0) is shown.
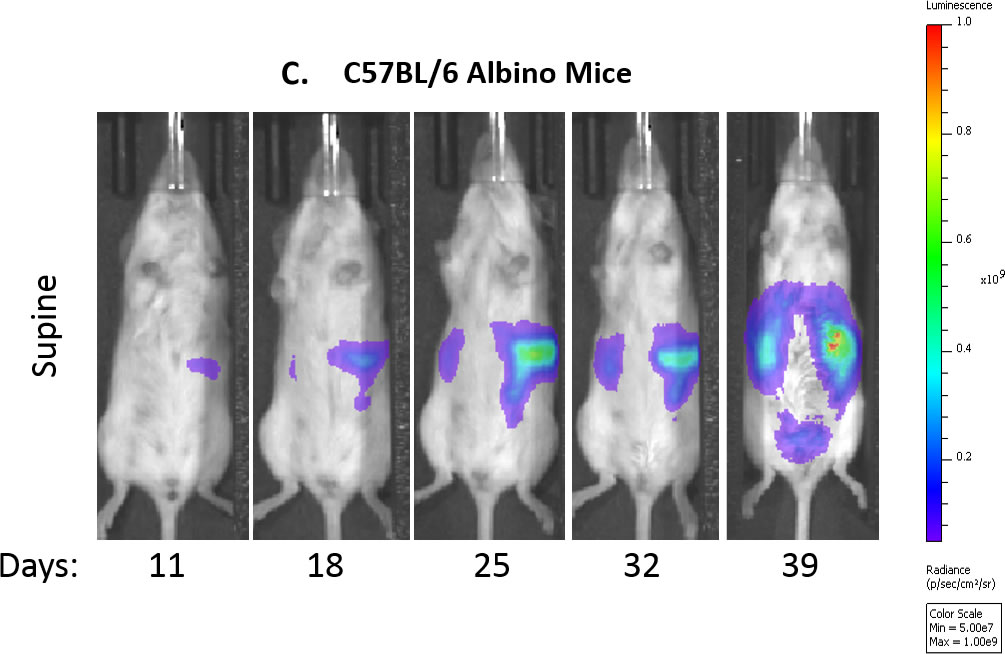
Fig. 1C: Representative bioluminescence images of control mouse over time.
Immunophenotype Evaluation of the Ascites Fluid
Clinical observations include extended abdomen due to accumulation of ascites at a more advanced disease state. Upon necropsy, solid tumor nodules within the peritoneal cavity, including the pancreas, liver, spleen, and abdominal wall, are observed.
Understanding the immune cell profile of syngeneic models is an important aspect in model choice. Thus, we evaluated the immunophenotype of the ascites fluid (Figures 2A, B, C) and found a large percentage of B cells, granulocytic myeloid derived suppressor cells (G-MDSCs), and both M1 and M2 tumor associated macrophage cells (TAMs). Further evaluation of the observed solid tumor nodules is being pursued.
Fig 2: Immunophenotyping of Ascites from ID8-luc Implanted Mice
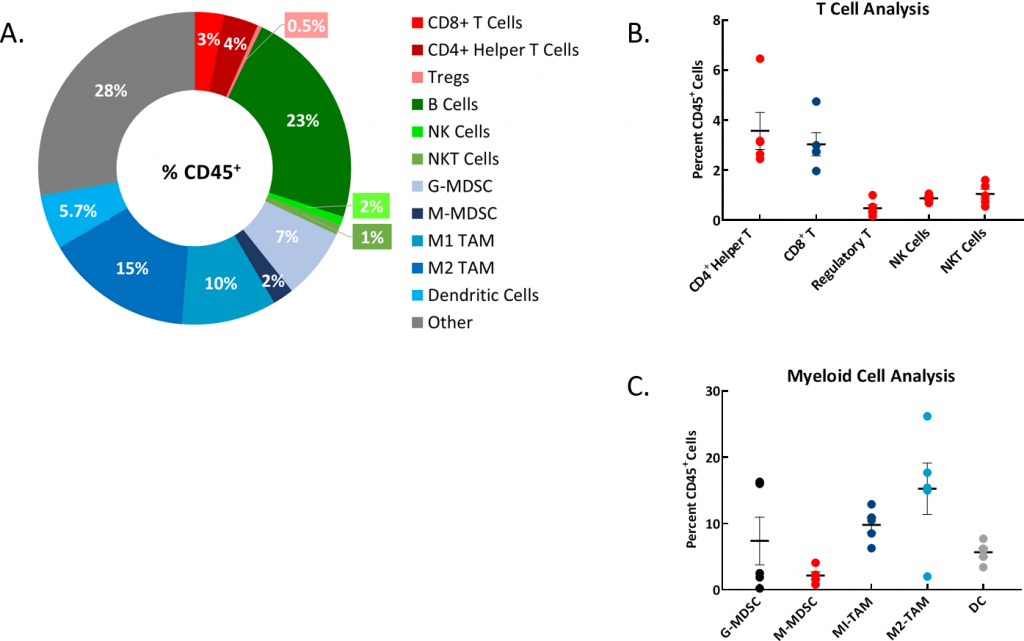
Fig. 2A: Representative donut plot shows distribution of immune cell populations as percent of total CD45+ population.
Fig 2B: Analysis of T cell populations.
Fig. 2C: Analysis of myeloid cell populations. Study run with n=5 individual mouse ascites samples.
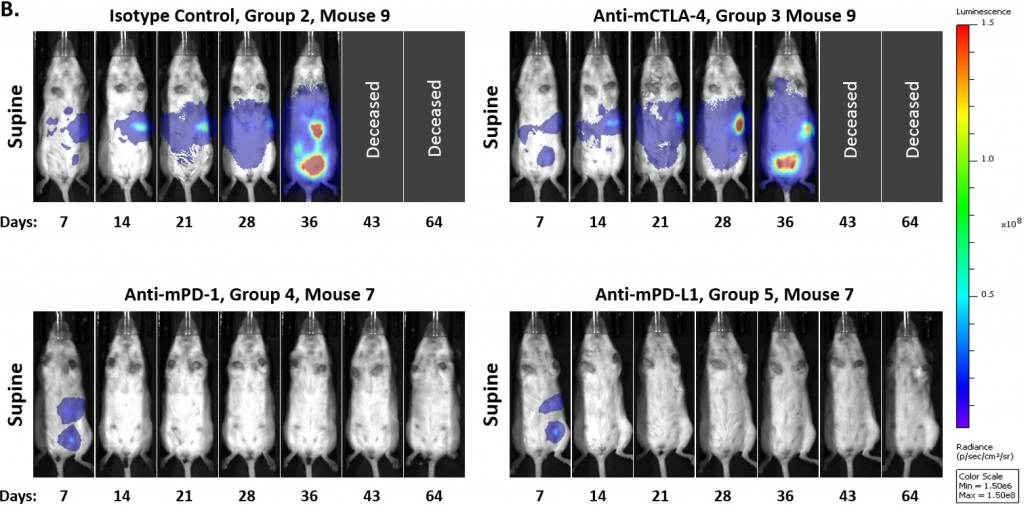
To determine whether the model was responsive to immune checkpoint inhibition, we tested anti-mPD-1, anti-mPD-L1, and anti-mCTLA-4 antibodies starting at either 7 or 14 days post tumor cell implant. Like many solid syngeneic tumor models, we found that response to these therapies varied depending on the timing of treatment initiation. In figures 3A and 3B we show that initiation of treatment with either anti-mPD-1 or anti-mPD-L1 antibodies 7 days post tumor cell implant resulted in complete regression of tumors, making this staging time unsuitable for drug combination work. In contrast, the model appeared refractory to anti-mCTLA-4 treatment. Furthermore, we observed that a small percentage of control tumors would spontaneously regress when the study was initiated on day 7.
Fig 3: Intraperitoneal ID8-luc: Mean and Individual Whole Body BLI Signal Over Time
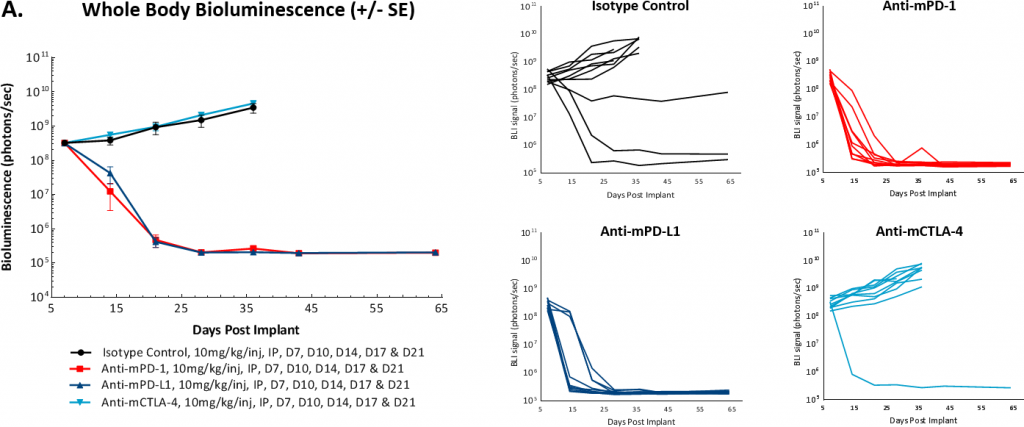
In a follow-on study we delayed the onset of treatment to 14 days post tumor cell implant and did not see spontaneous regression of control tumors. We also saw modulation of the overall response rate of the anti-mPD-1 or anti-mPD-L1 therapies. However, it still appeared that these antibodies produced an ?all or nothing? treatment response. In addition, reducing the antibody dose from 10mg/kg to 5mg/kg did not make a material impact on the anti-tumor activity of these agents (Figure 4). Future work will evaluate further delayed onset of antibody dosing to determine if we can continue to reduce the single agent activity of these checkpoint inhibitors.
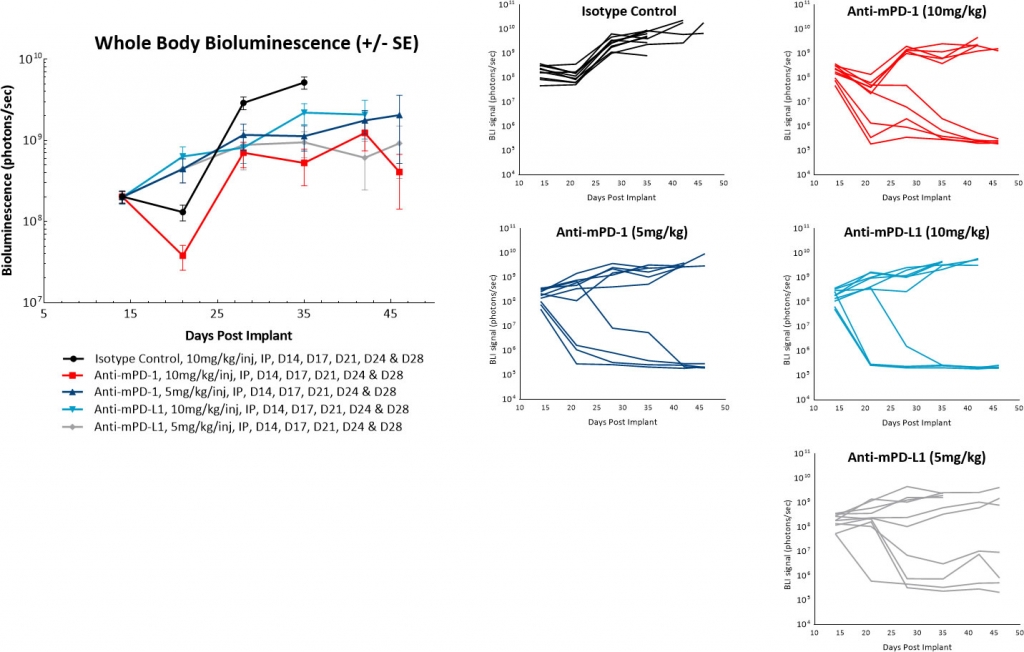
Table 1: Lung Cancer Cell Lines
See our A549 growth curve:
Labcorp has multiple lung cancer cell lines available for use (Table 1). Please contact us to run your next lung cancer study.
Fig. 4: Intraperitoneal ID8-luc: Mean and Individual Whole Body BLI Signal Following Treatment with Checkpoint Inhibitor Antibodies
